Entities
This section introduces various kinds of Entities supported by Cesium.js.
Cartesian
Cesium.js handles coordinates using Cartesian class. Cartesian may represent following 2 types of coordinates
- Pair of numerics, like
x,y,z - Geolocation (degrees), like
longitude,latitude,height
>>> import cesiumpy

>>> cesiumpy.Cartesian2(10, 20)
Cartesian2(10, 20)

>>> cesiumpy.Cartesian3(10, 20, 30)
Cartesian3(10, 20, 30)

>>> cesiumpy.Cartesian3.fromDegrees(-110, 40, 0)
Cartesian3.fromDegrees(-110, 40, 0)
Basically you don’t have to use the Cartesian classes because cesiumpy automatically converts python’s list and tuple to Cartesian based on it’s dimension.
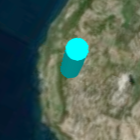
Point
You can create the Point entity as below. position keyword can accepts 3 elements of list or tuple consists from longitude, latitude and height. position will be converted to Cartesian3 automatically.
You can specify the color and size of the point via color and pixelSize keywords. Refer to the following document to see the details of each options.
>>> p = cesiumpy.Point(position=[-110, 40, 0])
>>> p
Point(-110, 40, 0)

>>> p.script
u'{position : Cesium.Cartesian3.fromDegrees(-110, 40, 0), point : {color : Cesium.Color.WHITE, pixelSize : 10}}'

>>> p = cesiumpy.Point(position=[-110, 40, 0], color=cesiumpy.color.BLUE, pixelSize=20)
>>> p
Point(-110, 40, 0)

>>> p.script
u'{position : Cesium.Cartesian3.fromDegrees(-110, 40, 0), point : {color : Cesium.Color.BLUE, pixelSize : 20}}'
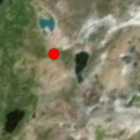
The color constants are defined in cesiumpy.color, also you can specify it by name (str).
>>> p = cesiumpy.Point(position=[-110, 40, 0], color=cesiumpy.color.RED)
>>> p.script
u'{position : Cesium.Cartesian3.fromDegrees(-110, 40, 0), point : {color : Cesium.Color.RED, pixelSize : 10}}'

>>> p = cesiumpy.Point(position=[-110, 40, 0], color='blue')
>>> p.script
u'{position : Cesium.Cartesian3.fromDegrees(-110, 40, 0), point : {color : Cesium.Color.BLUE, pixelSize : 10}}'
Label
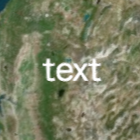
Label represents text displayed on the map. Refer to the following document to see the details of each options.
>>> l = cesiumpy.Label(position=[-110, 40, 0], text='xxx')
>>> l
Label(-110, 40, 0)

>>> l.script
u'{position : Cesium.Cartesian3.fromDegrees(-110, 40, 0), label : {text : "xxx"}}'

>>> l = cesiumpy.Label(position=[-110, 40, 0], text='xxx', fillColor='red')
>>> l.script
u'{position : Cesium.Cartesian3.fromDegrees(-110, 40, 0), label : {text : "xxx", fillColor : Cesium.Color.RED}}'
Box
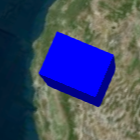
You can create the Box entity specifying its position and dimensions (size of each dimensions). Refer to the following document to see the details of each options.
>>> b = cesiumpy.Box(position=[-110, 40, 0], dimensions=(40e4, 30e4, 50e4))
>>> b
Box(-110, 40, 0)

>>> b.script
u'{position : Cesium.Cartesian3.fromDegrees(-110, 40, 0), box : {dimensions : new Cesium.Cartesian3(400000.0, 300000.0, 500000.0)}}'

>>> b = cesiumpy.Box(position=[-110, 40, 0], dimensions=(10, 20, 30), material='blue')
>>> b.script
u'{position : Cesium.Cartesian3.fromDegrees(-110, 40, 0), box : {dimensions : new Cesium.Cartesian3(10, 20, 30), material : Cesium.Color.BLUE}}'
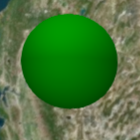
Ellipse
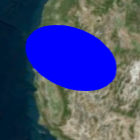
Ellipse can be created by specifying its position, semiMinorAxis and semiMajorAxis. Refer to the following document to see the details of each options.
>>> e = cesiumpy.Ellipse(position=[-110, 40, 0], semiMinorAxis=25e4,
...                      semiMajorAxis=40e4)
>>> e
Ellipse(-110, 40, 0)

>>> e.script
u'{position : Cesium.Cartesian3.fromDegrees(-110, 40, 0), ellipse : {semiMinorAxis : 250000.0, semiMajorAxis : 400000.0}}'

>>> e = cesiumpy.Ellipse(position=[-110, 40, 0], semiMinorAxis=100,
...                      semiMajorAxis=200, material='green')
>>> e.script
u'{position : Cesium.Cartesian3.fromDegrees(-110, 40, 0), ellipse : {semiMinorAxis : 100, semiMajorAxis : 200, material : Cesium.Color.GREEN}}'
Cylinder
Cylinder can be created by its position and length. Note that its position must be specified with the center of the Cylinder. If you want to put the cylinder on the ground, height should be 100 if cylinder’s length is 200. Refer to the following document to see the details of each options.
>>> c = cesiumpy.Cylinder(position=[-110, 40, 100], length=200,
...                       topRadius=100, bottomRadius=100)
>>> c
Cylinder(-110, 40, 100)

>>> c.script
u'{position : Cesium.Cartesian3.fromDegrees(-110, 40, 100), cylinder : {length : 200, topRadius : 100, bottomRadius : 100}}'

>>> c = cesiumpy.Cylinder(position=[-110, 40, 250], length=500,
...                       topRadius=100, bottomRadius=100,
...                       material=cesiumpy.color.ORANGE)
>>> c.script
u'{position : Cesium.Cartesian3.fromDegrees(-110, 40, 250), cylinder : {length : 500, topRadius : 100, bottomRadius : 100, material : Cesium.Color.ORANGE}}'
Polygon
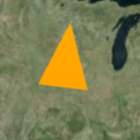
Polygon can be created by positions kw which specifies list of positions (longitude, latitude ...). The last position will be automatically connected to the first position. Refer to the following document to see the details of each options.
>>> p = cesiumpy.Polygon(hierarchy=[-90, 40, -95, 40, -95, 45, -90, 40])
>>> p
Polygon([-90, 40, -95, 40, -95, 45, -90, 40])

>>> p.script
u'{polygon : {hierarchy : Cesium.Cartesian3.fromDegreesArray([-90, 40, -95, 40, -95, 45, -90, 40])}}'
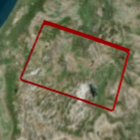
Rectangle
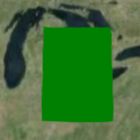
Rectangle can be created 4 elements of list or tuple, which represents south west longitude, south latitude, east longitude and north latitude. Refer to the following document to see the details of each options.
>>> r = cesiumpy.Rectangle(coordinates=(-85, 40, -80, 45))
>>> r
Rectangle(west=-85, south=40, east=-80, north=45)

>>> r.script
u'{rectangle : {coordinates : Cesium.Rectangle.fromDegrees(-85, 40, -80, 45)}}'
Ellipsoid
Refer to the following document to see the details of each options.
>>> e = cesiumpy.Ellipsoid(position=(-70, 40, 0), radii=(20e4, 20e4, 30e4))
>>> e
Ellipsoid(-70, 40, 0)

>>> e.script
u'{position : Cesium.Cartesian3.fromDegrees(-70, 40, 0), ellipsoid : {radii : new Cesium.Cartesian3(200000.0, 200000.0, 300000.0)}}'
Wall
Refer to the following document to see the details of each options.
>>> w = cesiumpy.Wall(positions=[-60, 40, -65, 40, -65, 45, -60, 45],
...                   maximumHeights=10e4, minimumHeights=0)
>>> w
Wall([-60, 40, -65, 40, -65, 45, -60, 45])

>>> w.script
u'{wall : {positions : Cesium.Cartesian3.fromDegreesArray([-60, 40, -65, 40, -65, 45, -60, 45]), maximumHeights : [100000.0, 100000.0, 100000.0, 100000.0], minimumHeights : [0, 0, 0, 0]}}'
Corridor
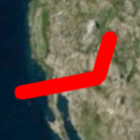
Refer to the following document to see the details of each options.
>>> c = cesiumpy.Corridor(positions=[-120, 30, -90, 35, -60, 30], width=2e5)
>>> c
Corridor([-120, 30, -90, 35, -60, 30])

>>> c.script
u'{corridor : {positions : Cesium.Cartesian3.fromDegreesArray([-120, 30, -90, 35, -60, 30]), width : 200000.0}}'
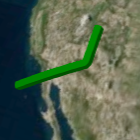
Polyline
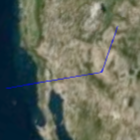
Refer to the following document to see the details of each options.
p = cesiumpy.Polyline(positions=[-120, 25, -90, 30, -60, 25], width=0.5)
>>> p
Polyline([-120, 25, -90, 30, -60, 25])

>>> p.script
u'{polyline : {positions : Cesium.Cartesian3.fromDegreesArray([-120, 25, -90, 30, -60, 25]), width : 0.5}}'
PolylineVolume
Refer to the following document to see the details of each options.
>>> p = cesiumpy.PolylineVolume(positions=[-120, 20, -90, 25, -60, 20],
...                             shape=[-5e4, -5e4, 5e4, -5e4, 5e4, 5e4, -5e4, 5e4])
>>> p
PolylineVolume([-120, 20, -90, 25, -60, 20])

>>> p.script
u'{polylineVolume : {positions : Cesium.Cartesian3.fromDegreesArray([-120, 20, -90, 25, -60, 20]), shape : [new Cesium.Cartesian2(-50000.0, -50000.0), new Cesium.Cartesian2(50000.0, -50000.0), new Cesium.Cartesian2(50000.0, 50000.0), new Cesium.Cartesian2(-50000.0, 50000.0)]}}'
Billboard
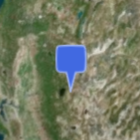
Billboard can dispaly a image on the map. Currently it supports to draw pins. You can pass Pin instance to the Billboard via image keyword.Refer to the following document to see the details of each options.
>>> p = cesiumpy.Pin()
>>> b = cesiumpy.Billboard(position=(-110, 40, 0), image=p)
>>> b
Billboard(-110, 40, 0)

>>> b.script
u'{position : Cesium.Cartesian3.fromDegrees(-110, 40, 0), billboard : {image : new Cesium.PinBuilder().fromColor(Cesium.Color.ROYALBLUE, 48)}}'
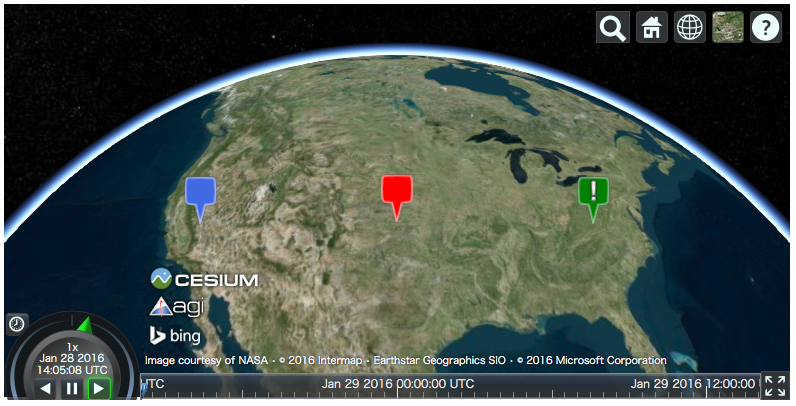
You can change how Pin looks as below. Also, Pin can have label text to be displayed.
>>> v = cesiumpy.Viewer(**options)
>>> pin1 = cesiumpy.Pin()
>>> bill1 = cesiumpy.Billboard(position=[-120, 40, 0], image=pin1)
>>> v.entities.add(bill1)

>>> pin2 = cesiumpy.Pin(cesiumpy.color.RED)
>>> bill2 = cesiumpy.Billboard(position=[-100, 40, 0], image=pin2)
>>> v.entities.add(bill2)

>>> pin3 = cesiumpy.Pin.fromText('!', color=cesiumpy.color.GREEN)
>>> bill3 = cesiumpy.Billboard(position=[-80, 40, 0], image=pin3)
>>> v.entities.add(bill3)
>>> v
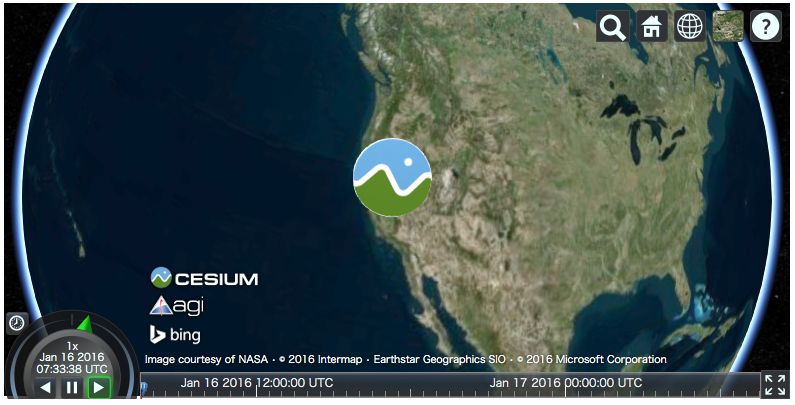
Material
You can use image file path via material keyword. The entity will be filled with the
specified image.
v = cesiumpy.Viewer()
e = cesiumpy.Ellipse(position=(-120.0, 40.0, 0), semiMinorAxis=40e4,
                     semiMajorAxis=40e4, material='data/cesium_logo.png')
v.entities.add(e)
v